

Claude Code + 50 interview transcripts: three ways I query the data
How I use Claude Code to make sense of a growing library of interview data. Full walkthrough of my setup.

I have 50+ interview transcripts sitting in a folder. As I do discovery, I’m constantly refining the ICP, revising interview questions, and shifting focus between opportunities.
Before Claude Code, making sense of all this unstructured, messy interview data was painful.
ICP change? Re-read everything to decide who still counts. Focusing on a new opportunity? Go back through transcripts to find “what was really said” and “which job step does that belong to”.
If you turn your interview data into a structured ‘library’, Claude Code can function like that member of the Product Trio you’ve always dreamt of. It can pull insights, return direct quotes, and segment by any attribute you care about.
This article walks through my setup.
Content
Where this fits with OSTs
The setup: folders and files
Three ways to query your transcripts: conversation, tabular, visual
Where this fits with OSTs
I’ve been using Opportunity Solution Trees for four years, and I’ve brought them into several product teams. It’s still the best tool I know for connecting customer opportunities to the outcomes you’re actually trying to drive.
The “worst” product teams are instantly implementing every request that comes up. The “mid-level” team keeps a flat list of requests and keeps tally.
Neither of these can connect their work to outcomes. This is where OSTs are great.
But they come with challenges.
OSTs get unruly. Mine tend to start horizontal and wide, then grow into something messy (I can’t see the forest for the trees, pun intended). I do quarterly cleanup sessions where I try to restructure based on what I’ve learned. But every time I do, I’m overwriting what was there. I’m introducing bias. I might be losing something important, or rephrasing something in a way that loses its essence.
The framing is hard to get right. What I choose for the first level —do I split by persona? By moment in time? By use case? —dictates the entire shape of the tree. I’m still not always confident I’ve chosen right.
The biggest problem: when context changes, you can’t go back. We decide to shift ICP. Or we add a new profiling attribute we care about. In theory, I should re-read all 50 transcripts and redraw the tree from scratch. In practice, I just start over.
This is where Claude Code helps. It has access to all my transcripts. When my “listening for” changes, I can re-query the data in minutes. I can ask: “Please go through my interviews in folder (x) and tell me which files belong to interviewees matching our ICP as per company context> ICP.md”, and have it look at only those files from now on.
I’m not ready to abandon OSTs (ask me again in a year?). I use Claude Code to challenge my thinking, catch my blind spots, reframe, and go back to the original (”what was really said?”).
The setup: folders and files
For this to work, you need structure. Here’s mine.
Folder structure
```
(product or company name)/
├── Company/
│ ├── icp-and-jtbd.md
│ ├── goals-2026.md
│ ├── product-overview.md
│ └── ...
├── Research/
│ └── interviews/
│ ├── marcus-chen-2025-11-15.md
│ ├── sarah-okonkwo-2025-11-18.md
│ └── ... (+n files)
└── CLAUDE.md
```
The `Company/` folder holds context: ICP definition, current goals, product overview, etc. This helps Claude understand what we’re talking about.
The `Research/interviews/` folder holds the transcripts. One file per interviewee.
The `CLAUDE.md` file contains project instructions. Mine says: ”Weight my manual notes higher than the AI transcript summary when identifying insights and opportunities.” More on that below.
File structure for each interview
Every interview file follows the same format:
```markdown
# Interview: Marcus Chen
**Date:** November 15, 2025
**Duration:** 35 minutes
---
## PROFILING DATA
| Question | Answer |
|----------|--------|
| Role | Backend Developer |
| Seniority | Senior (6 years) |
| Company type | Scale-up (~200 employees) |
| Region | US West Coast |
| Current IDE | VS Code + Copilot |
| AI proficiency | 7/10 |
---
## MANUAL NOTES
### Insights
1. **Team friction is about context, not tools** — His frustration isn’t...
2. ...
### Opportunities
- Could we surface “AI contribution %” on PRs?
- ...
### Key quotes
---
## INTERVIEW TRANSCRIPT
**Maya:** Thanks for joining, Marcus...
```
Three sections matter:
Profiling data. The attributes I use to segment later. For the dev-tool I’m building: Role, seniority, company type, tech stack, AI proficiency. I ask my agent to listen for responses to these questions at the start of each call.
Manual notes. Yes, I use a note-taker (if my interviewee is OK with it), but I don’t trust it to pick the right insights and opportunities. I take manual notes during the call and pull out my own. My CLAUDE.md tells Claude to weight these higher.
Full transcript. The raw conversation. Claude can query this when I need to understand the problem and context better, and to return to “what was really said”.
The consistency in structure matters, it’s what makes querying possible.
(I’m using the Claude Code plugin in Windsurf, but you can do this in any IDE.)
Three ways to query your transcripts
Once you have the structure, here’s what you can do.
1. Conversational: Just ask
The simplest approach. Open Claude Code in your project folder and ask questions.
> “What’s the most common pain point across all interviews?”
> “Give me all quotes around the pain point “xxxx”“
> “Summarize what senior engineers at corporates say about AI collaboration.”
This works, but you don’t see how that answer relates to everything else. You don’t see the distribution. It will tell me the most common pain point, but not how that sits amongst the others.
2. Tabular: Generate a CSV
I ask Claude to create a structured table from all my interviews. Something like:
“Go through all interview files in Research/interviews/. For each one, extract:
- Name
- Role, seniority, company type, region
- Current IDE, AI proficiency
- Main friction (categorize into: invisible AI contributions, tool fragmentation, review burden, knowledge transfer breakdown, missing context, style drift, skill assessment difficulty, trust gap, lack of guidance, workflow mismatch)
- Main friction (free text)
- How often this friction occurs (daily, weekly, monthly, rarely)
- Severity (low, medium, high, critical)
- Their magic wand wish (categorised)
- Their magic wand wish (free text)
Output as a CSV.”
Claude reads all 50 files and spits out a table. I open it in Windsurf with the Edit CSV plugin. Now I can see everything at once.
The magic is in the categories. Most cells have are single or multiple select, only the “free text” columns are different. This makes analysis so much easier.
I define the categories upfront, based on patterns I’ve seen. Claude does the classification. I can also invite Claude Code into the process of defining the right categories, but you want to start with your own thinking.
I used to try to maintain such a table manually in Airtable (inspired by “Forget the Funnel” by Georgiana Laudi and Claire Suellentrop), but it was prone to human error and added even more manual work. Now it takes minutes.
3. Visual: Charts with segmentation
Tables are good. Charts are prettier (and better for spotting patterns ;)
I ask Claude to generate an HTML dashboard from the CSV:
“Create an interactive HTML dashboard from the CSV with:
Horizontal bar charts for categorical data (friction category, role, company type, magic wand)Vertical bar charts for ordinal data, in order (severity: low→critical, occurrence: daily→rarely)Filter dropdowns for seniority, company type, region — charts should update when filteredA data table at the bottom showing filtered results with the free-text columns
Use Chart.js. Open the HTML file when done”
Claude generates the HTML, opens it in my browser, and I have an interactive dashboard. I can filter to “senior devs at corporates” and see how the pain point distribution shifts. I can compare “startups” vs “scale-ups” and spot the differences.
I love this - Segmentation in seconds.
When I’m reviewing my OST, I pull up this dashboard. I check: does my tree match what the data shows? If seniors at corporates care most about review burden, but my OST prioritizes tool fragmentation, maybe something’s off.
OST’s are dead - long live OST’s
You might think: if Claude can query transcripts and generate charts, why not have it draw the OST directly?
I tried. Did not go well.
I gave Claude a few of Teresa Torres’ articles on opportunity mapping and access to my interview transcripts. The output *looked like* an OST - boxes, lines, hierarchy - but the structure made no sense. It put a fluffy business goal on top. The framing was wrong. The parent-child relationships were random.
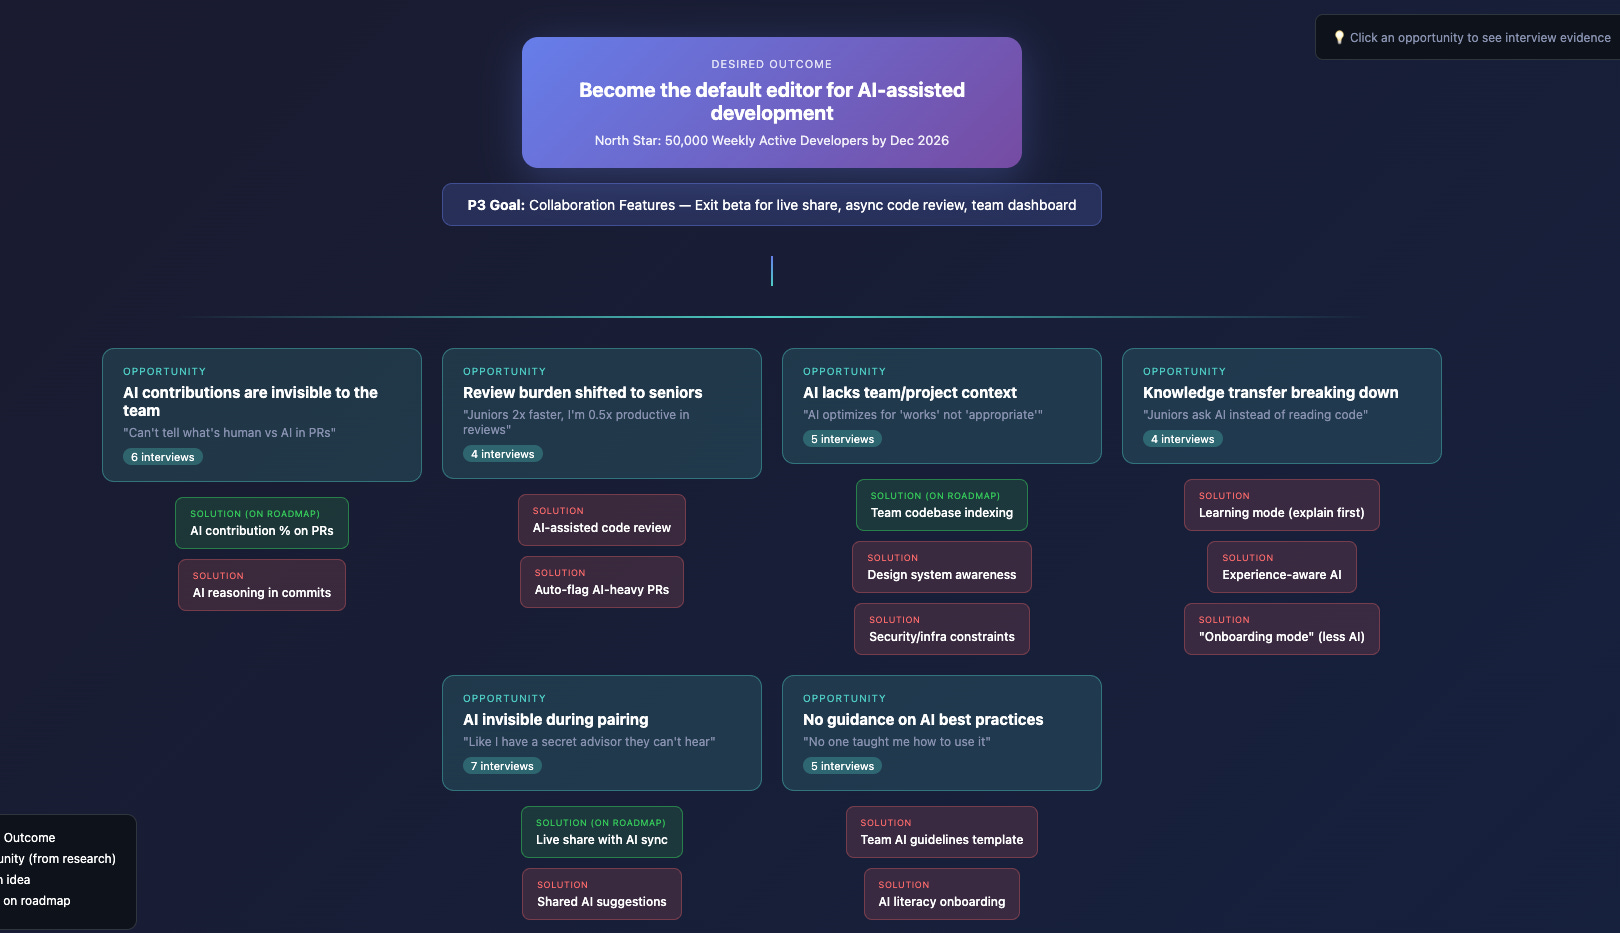
This is a bad OST.
I’m not surprised. If I handed those same articles to a smart person who’d never done OST work, their first attempt wouldn’t be great either. Getting the framing right takes practice. It’s a muscle you build over years.
(I suspect Teresa Torres is working on an AI product for this. But even then, it’s a muscle I personally want to keep training.)
Key takeaways
1. Structure your interviews for rqueryability. Same format, same profiling questions, same sections. Consistency is what makes this work.
2. Use Claude three ways: conversationally for quick checks, tabular for full synthesis, visual for pattern spotting and segmentation.
3. Segmentation is the unlock. When your ICP shifts or you add new profiling attributes, re-query in minutes instead of re-reading for days.
4. Don’t abandon your OST. Use Claude to challenge it, not replace it. Your own thinking + the tree structure still matter.
Work with me? I work with SaaS startups and scale-ups as an advisor or as an interim product lead. Connect with me on LinkedIn if you’d like to chat.
The three-approach pattern (conversational, CSV, dashboard) is how I naturally evolved too. Started by asking my agent questions directly, then needed exports for analysis, then realized I needed a visual layer to actually make decisions.
The "build a dashboard" instinct is universal once your data outgrows a conversation. My agent went through the same progression - markdown notes to spreadsheet to custom dashboard. Rebuilt it twice before it worked: https://thoughts.jock.pl/p/wiz-1-5-ai-agent-dashboard-native-app-2026
The OST limitations you describe - unruly growth and inability to adapt when priorities shift - is the core problem. Static frameworks break when context changes. Queryable data doesn't.
Love the article and thanks for sharing this!
Maybe a stupid question, but aren’t OST just bullet lists with different levels (objective, opportunity, solutions, sub-solutions, assumptions, …)? Shouldn’t this be an easier way for an LLM to interact with it? Then you can still think about turning the list into a visual later on for easier digestion.