

Synthesizing qual, quant, and strategy with Claude Code + PostHog MCP
A practical walkthrough: from diagnosing revenue drops, onboarding friction, to validating "aha" moments and business opportunities

Over the past four years I’ve coached 50+ product teams. Every single one of them was trying to be “data-informed.” Almost all of them spent hours staring at product analytics reports - DAU, revenue trends, funnel reports, retention curves, feature usage - and struggled to find a clear “now what?”
The data shows what is happening. It never tells you why. Or what to do about it.
Two things separate PMs who stare at dashboards from PMs who act:
1. Interpreting what you see. “Is this normal?” “What does this mean?”
2. Connecting quant. to qual. What users do vs. what they say
Your quantitative data lives in PostHog (or Amplitude, or Mixpanel). Your qualitative data lives in Notion, Dovetail, or scattered Google Docs. Your deployment history is in Linear. Your knowledge of seasonality patterns lives in your head.
When product analytics tools started launching their in-app AI assistants I was genuinely excited for how they can help solve the first problem. Especially the latest iterations (I’m looking at you, Posthog AI!) are genuinely good at natural language queries.
But none of these in-app AI agents can’t touch the second problem. Because they only see what’s inside their own tool.
This article is about solving both at once: plugging a product analytics MCP into Claude Code, where it can query your data and access your qualitative context in the same conversation.
Here are five important product management questions that become far easier to answer when Claude Code merges qual. and quant. for you.
Content
1. Why did revenue drop? (debugging with deployment logs + seasonality)
2. Where are users dropping off, and why? (funnel + usability transcripts)
3. Who are my power users? (behavioral segmentation)
4. What makes users stick? (finding Aha moments)
5. Is this opportunity real? (validating ideas with quant + qual)
How the PostHog MCP actually works
If you’re not a Posthog user, rest assured: Most established tools (e.g. Mixpanel, Amplitude, Google Analytics, Pendo) also offer proprietary MCPs.
Before running queries, I wanted to understand how the MCP works - and where I should expect results to differ from PostHog's UI.
The PostHog MCP gives Claude direct access to your analytics data via HogQL (PostHog’s SQL layer). Claude can query events, user properties, run trend analyses, build funnels - the same things you’d do in the UI, but programmatically. Claude Code is not “stuck” with the filters or pre-built visualizations that the Posthog UI has, but can query the underlying data.
However, the real power isn’t SQL access. Posthog’s latest built-in AI assistant already has that.
The gold is that Claude Code also has access to your local files.
What I mean by “local context”
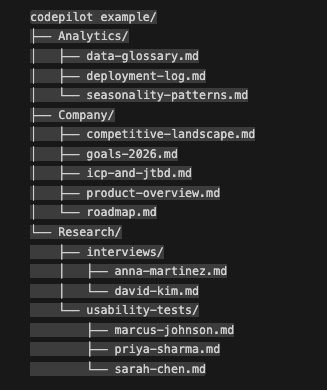
In my setup, Claude Code has access to a local project folder containing:
Company context folder
Product overview (what we build, for whom, key features)
ICP and jobs-to-be-done
Current goals and metrics (e.g. OKRs, product metrics)
Analytics context**
Data glossary (what each event and property actually means)
Seasonality patterns (expected usage dips on weekends, holidays)
Deployment log (what we shipped and when)
Qualitative data
Usability test transcripts (moderated sessions watching new users)
Interview transcripts (discovery conversations, churn interviews)
PostHog AI knows your events, but it doesn’t know that step 3 of your onboarding is called “AI setup” and involves a confusing choice between local and cloud models. It doesn’t know you expect 40% less usage on weekends. It doesn’t know that three users complained about that exact step in last week’s usability tests.
You can give Claude Code access to all of it - making it a far more powerful partner for the deep dives.
Use case 1. Why did revenue drop? (debugging with deployment logs + seasonality)
You probably haven’t been a PM for long if you haven’t felt this pain. The CEO appears at your desk: “Revenue dropped 10% since Friday. What happened?” With the unspoken subtext: *How did you not notice this yet?!*
Down the rabbit hole you go.
Is it a fluke? Most day-to-day variance is just noise. Before I start panicking, I need to know if this is even statistically significant.
Is it seasonality? Maybe 60% of our customers are US-based and it’s Thanksgiving week. Maybe it’s a dev tool and weekends always dip.
Is it something we did?
Here’s where combined context helps.
I ask Claude: “Revenue dropped 10% since Friday. Is this significant, or within normal variance?”
Claude has access to historical data via PostHog *and* my seasonality documentation. It checks whether this dip fits our expected patterns.
In this case: no, it doesn’t. This isn’t a holiday effect, and the dip is too big to be a fluke. Something might be actually wrong.
Claude Code is quite good at proposing follow up questions, and you can work together to drill down on the issue.
“Can you break this down by payment method?”
Claude queries the data and finds: zero new customers paying by invoice since Friday. Credit card and PayPal are fine. Invoice is completely dead.
“Check the deployment log for anything related to billing or payments.”
It finds a release on Thursday that included “billing service refactor.”
It looks like we broke invoice payments...
The verdict: Without combined context, I’d be jumping between PostHog, internal docs, and the deployment log, trying to hold the connections in my head. With Claude Code, the synthesis happens in one place.
Use case 2. Where are users dropping off, and why? (funnel + usability transcripts)
I’ve spent countless hours staring at onboarding funnels.
Step 1 (100%) → Step 2 (84%) → Step 3 (67%) → Step 4 (41%)...
The funnel shows you what is happening. Users are dropping off at step 3. But it doesn’t tell you why.
Translating “step 3” back to the actual product required mental gymnastics. Wait, what is step 3 again? What does the user see there? Clicking which button triggers the event that moves them to step 4?
Claude Code reduces this cognitive load because it has access to my data glossary.
“What is step 3 in the onboarding funnel? What event triggers the transition to step 4?”
Claude tells me: Step 3 is “AI setup” where users choose between local and cloud AI. The transition event is `onboarding:step_complete` with `step_name: ai_setup`.
Sweet, thanks!
But even sweeter: I also have moderated user test transcripts in my project folder - sessions where I watched new users go through onboarding while thinking aloud.
“I see a 33% drop-off at step 3 (AI setup). Can you search the usability test transcripts for any friction or confusion at this step?”
Claude searches and finds:
> Sarah: “Wait, do I need to enter an API key? This is more complicated than Copilot. I just want it to work.”
> Marcus: “I don’t understand any of this. What’s a local model? Do I need a GPU?” *(He abandoned onboarding here.)*
The what: 33% of users drop off at step 3.
The why (hypothesis): Users don’t understand the local vs. cloud AI choice. It feels technical and intimidating.
The verdict: The funnel told me where, the transcripts told me why. Now I have a concrete customer pain point, to which I can ideate solutions (e.g. simplify the AI setup step, or default to cloud).
3. Who are my power users? (behavioral segmentation)
I push every product team I work with to segment users by behaviour, e.g power users vs. active vs. dormant vs. churned.
Once you know who your power users are, you can:
Analyze their properties to sharpen your ICP definition
Interview them to understand what drew them in and what's working - these are the users worth building for.
Study what they did differently in their first days compared to the other user segments
But defining these segments is pretty hard. What constitutes a power user for your product? Is it frequency? Feature depth? Recency? Some combination?
In my setup, Claude Code has context on my product (what features matter, what our ICP looks like, what jobs we’re solving) and can immediately test definitions against real data. This enables Claude to be an excellent sparring partner.
“Based on our product and ICP, propose segment definitions for power users, active users, casual users, and dormant users.”
Claude suggests:
Power User: Active 8+ days in last 30, used AI features AND cloud sync, active within last 7 days
Active User: Active 3-7 days, may or may not use AI, active within last 14 days
Casual User: Active 1-2 days, basic usage only, high churn risk
Dormant: Was active, now 0 days in last 30
I push back: “Only 18% of users ever use cloud sync. Is that too restrictive for power users?”
Claude adjusts. We go back and forth.
The verdict: The back-and-forth would be painful in a dashboard. And because Claude has product context, the suggestions actually make sense for our product, not generic benchmarks.
4. What makes users stick? (finding Aha moments)
The “Aha moment” is the first moment a new user realises the value of your product. Finding it matters, because it tells you exactly what to drive more users toward. If users who do X in their first 7 days retain at 3x the rate - make X more discoverable.
I approach this from three angles:
1. Start with a hypothesis. Based on our core value prop (AI-assisted coding), I hypothesize: users who accept 5+ AI suggestions in their first week will retain better.
Claude can test this immediately. Create cohorts, compare retention curves. Do the numbers support my hypothesis?
2. Mine the qualitative data. I have transcripts from interviews with power users. In these interviews I always ask “When you just started using (product), at what moment did the value really click for you” or “at what moment did you think ‘this really helps me’”.
With my interview transcripts at hand, I ask Claude:
“Search the interviews for moments where users describe when the product ‘clicked’ for them.”
Claude finds patterns:
>David: “The AI chat actually understood my whole project. That was the aha moment. Copilot can’t do that.”
Multiple users mention the codebase-aware chat, not the inline suggestions.
Interesting. Maybe the Aha isn’t “accept AI suggestions.” Maybe it’s “have a minimum 5-turn AI chat interaction.”
Now create a cohort of “users that have a 5+ turn chat interaction within n days”, and compare their retention rate agains a) the baseline and b) “users that accepted n AI suggestions within n days”.
3. Compare segments quantitatively. Compare power users vs. others. What did power users do in their first n days that others didn’t?”
5. Is this opportunity real? (validating with quant + qual)
The CEO comes back from a conference.
“I’ve been talking to people, and the future is mobile-first coding with voice-to-text input. We should build this.”
Your job: validate (or invalidate) this quickly, before the team spends months chasing a shiny object.
Check the qualitative data. “Search all interview and usability test transcripts for any mentions of mobile, phone, or voice input.”
Claude searches. Result: Not a single user has ever brought this up unprompted. But of course, that can also be because we never asked...
Check the quantitative data. “What percentage of our sessions come from mobile devices?”
Claude queries PostHog. Result: 0.3% of sessions are mobile. And those mobile sessions average 45 seconds (vs. 25 minutes on desktop) - people checking something quickly, not actually coding.
No users have asked for mobile. Almost no users access the product on mobile. This doesn’t definitively kill the idea. Maybe there’s a latent need nobody’s articulated yet. But it’s enough to say: “We have zero signal that our users want this at this point”.
The verdict: That’s a 10-minute analysis that would have taken a week of manually combing through transcripts and staring at (stale…) dashboards.
Caveats
Numbers may not always match the analytics tool UI. When Claude queries via HogQL, results sometimes differ from PostHog’s dashboard - sampling, timezone handling, default filters, caching. For directional analysis, this is fine. For board-level metrics, verify in the UI.
This requires setup and maintenance. You need to organize your local context. Create the folders, maintain the data glossary, keep transcripts accessible. The MCP gives you the connection; you provide the context worth connecting to. As you keep adding more and more transcripts/qualitative data, you’ll need to find a solution to managing Claude Code’s context window in a smart way (I’ll dive into that in a separate article).
It’s a multiplier, not a replacement. Claude won’t tell you what to build. It helps you see patterns faster, ask better questions, connect dots you’d otherwise miss. Product intuition still matters (and I strongly doubt that AI can ever “learn” human intuition).
Final thoughts: The why behind the what
Every product analytics tool can tell you what is happening. The hard part was always why and now what.
And the answer to “why” usually lives somewhere else - in a usability test transcript, a deployment log, an interview with a churned user, or your own knowledge of seasonality patterns.
Claude Code with an analytics MCP gives you a sparring partner who can see the quantitative data and the qualitative context and the operational history.
That’s gold.
Want to try this yourself? Start with one question you’ve never been able to answer with dashboards alone. Then add the context that would help answer it.
Work with me? I work with SaaS and AI startups as an advisor or as an interim product lead. I’m excited about what LLMs unlock for product discovery. Connect with me on LinkedIn if you’d like to chat.
This is a great practical example of MCP in action. The insight about dashboards showing the 'what' but not the 'why' is something I've been thinking about a lot. I've been using Claude Code with various MCPs (Notion, Chrome, custom tools) and the real power isn't any single integration, it's the compound effect of giving an agent access to multiple context sources simultaneously. Your PostHog MCP setup for combining quantitative data with qualitative insights is exactly the kind of practical use case that makes agent architecture worthwhile. I covered 10 similar practical examples of what you can do with MCP and agent setups in daily work: https://thoughts.jock.pl/p/ai-agent-use-cases-moltbot-wiz-2026