


(How) Can PMs Forecast Product Idea Revenue?
Three concrete examples of simplified revenue calculations, and a deep-dive into 'should we even bother at all?'

Contents:
Guesstimating your way to a revenue-forecast (3 simplified revenue calculations for different use cases)
Category 1: High volume/small ticket size
Category 2: Low volume/big ticket size
First off: Can we expect PMs to forecast revenue for new product ideas?
Some time ago, I posted on LinkedIn about the importance of financial acumen for product managers.
“Product managers need to consider the financial implications of their decisions. Basic math is a must.
I wouldn't go as saying PMs should 'own the P&L', but they should have the business understanding and strategic insight to create a business case to support their decision-making.
This doesn't need to be highly complex (when we try to predict the future we're usually wrong anyway). Sometimes a rough back-of-napkin calculation is enough to inform decision-making.
For example, to calculate the development cost already invested into a certain client or strategy, you can calculate the story points or actual time spent on that client or strategy (assuming you have neatly assigned the work to an epic or project 🙃 )
To calculate the development effort required for a new feature, take its rough scoping (i.e. roughly 5 sprints) and do the math. If you don't have actual internal labor costs, you can use an approximation of what a developer costs per day to calculate the cost of the scrum team per sprint. (PS don't forget yourself, you - the PM - also cost your company money!)
To calculate projected revenue, make a rough estimation of how this new feature might bring in new revenue (e.g. enabling new sales deals, or expanding existing customers). Stay as close to the truth as you can here (by looking at the actual pipeline & customer database) and don't speculate too much. You can also look at how well past features have performed to grab a baseline.

Example back-of-napkin calculation
What followed was an interesting debate about whether it’s even reasonable to expect PMs to predict revenue for ideas - and if so, how it can be done.
Getting to a decent cost calculation is relatively easy. PMs should consider the costs for discovery, delivery (‘cost for one sprint’ benchmark),, and distribution/GTM.
Calculating potential revenue is much, *much* harder, since it depends on a variety of factors outside of our control. The trickiest factor of all: market reception. An awkward fact to this point: appr. 80% of features are hardly or never used.
No matter how hard we try, even with the most robust spreadsheet models and chatGPT by our side, we still can’t predict the future. We’ll have to settle for the best guesstimate we can get by considering the data points we have at our disposal.
Guesstimating your way to a revenue forecast
In the following section, I distinguish between two main categories:
High volume / small ticket size models. We forecast primarily based on user analytics and experimentation data.
Low volume/ high ticket size models. We forecast primarily based on agreements with prospects/customers and sales loss analyses.
To keep calculations simple, I’m focusing only on acquisition metrics. When we make product decision x, what new revenue would that unlock (indirectly) or create (directly)? I’m purposefully leaving more complex realities out of scope, such as: what impact will our new product idea have on the retention rates for existing customers? Of course, this means we lose an important piece of the puzzle. I consciously accept this for the sake of simplicity.
High volume/ small ticket size
Examples of high volume, small ticket size business models are B2C or B2B with lower tier customers (e.g. SMEs).
In the section below I outline how you can gather relatively hard data and build forecasts for two example types of product decisions:
Feature ideas requested by customers
Ideas generated to improve new user onboarding
Features requested by customers
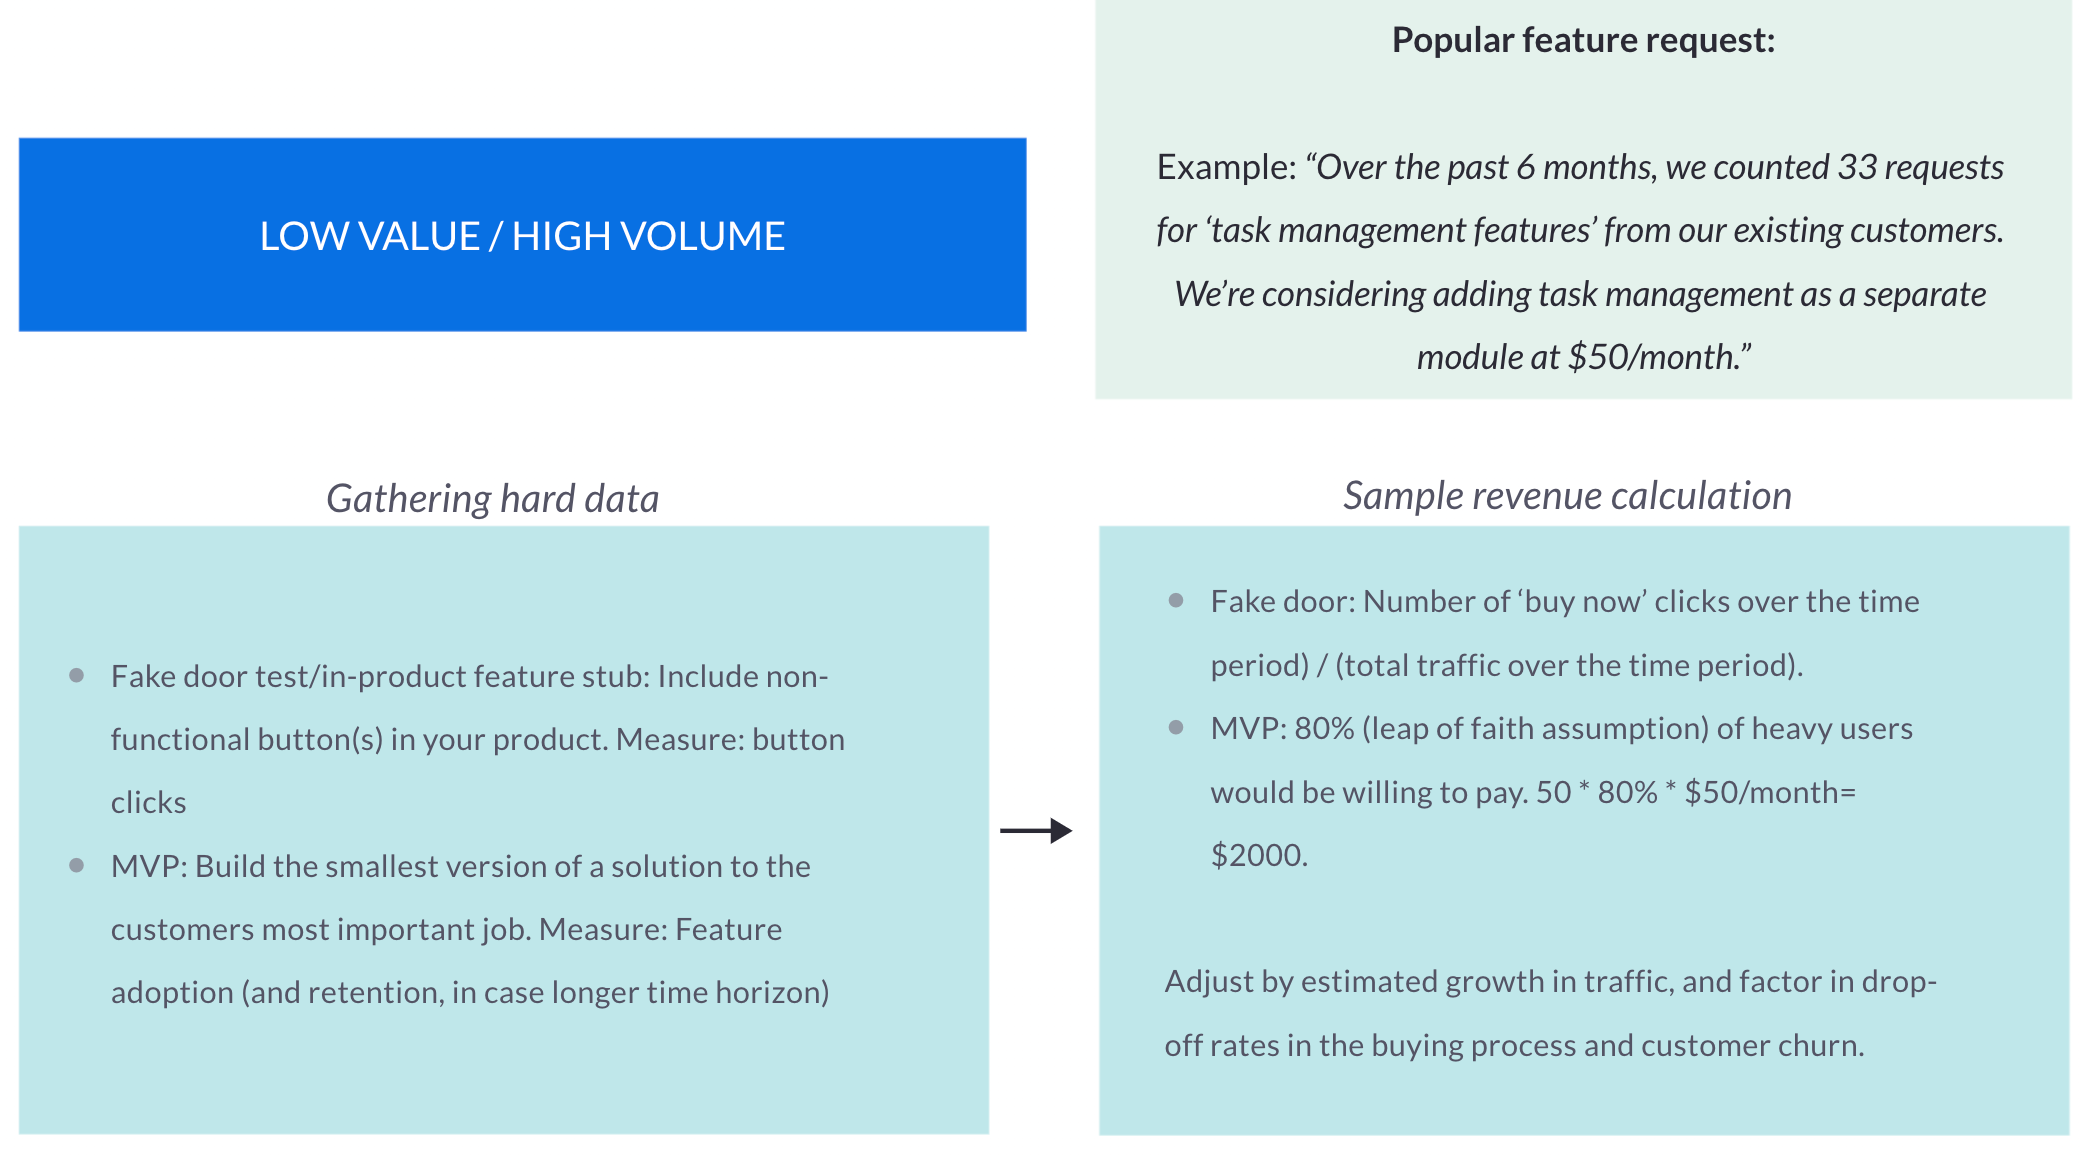
Scenario: We’re considering implementing a new feature request based on popular demand from our customers.
“Over the past 6 months, we counted 33 requests for ‘task management features’ from our existing customers. We’re considering adding task management as a separate module at $50/month.”
Firstly: We can’t assume that each of the 33 requesters will buy our task management module once it’s live.
Secondly, for the love of god, don’t pick a market share out of thin air (e.g. Monday.com has 3.31% market share. I guess we can grab 0.5%?!). Just because something works for Monday.com - a $$$ company with strong brand awareness - does not mean it will work for you - a relatively new and unknown startup.
Gather hard data for an evidence-based forecast
A forecast based on real usage data is far more robust than a forecast based on market data. You have no idea to which extent that market data is transferable to your company or product.
So how to gather that real usage data?
I recommend running either a lightweight fake door test (also called ‘feature stub’ in the product world) or an MVP test. This allows you to gage actual demand and willingness to pay, so that you can build a forecast based on the basis of that experimentation data.
Fake door test
Include the new task management menu item in your product. Clicking there could lead to a payment gate (‘Buy now’, to capture willingness to pay), after which a ‘coming soon’ message is displayed. Or you can use the space to ask your most burning questions about task management or to allow users to sign up for a co-creation process. The choice is yours!
The main metric you’re interested in is the number of clicks of the button.
MVP
Identify the main/highest impact customer job ‘task management’, and design the smallest version of the feature that solves that job. You create a small, yet important part of the product or module. Don’t spend time automating backend processes until you’ve learned that your customers show real interest in your new feature or module.
The main metric you’re interested in is adoption of the MVP. Feature retention (are users coming back to the feature?) can come into play if you’re testing over a longer time horizon.
When choosing your experiment and assessing evidence strength, consider that a high-quality MVP teaches you more than a fake door test - since it shows you actual feature usage, not just button clicks-, but it’s also a lot more expensive and time-consuming to run.
Revenue calculation example
Fake door test results
50 clicks on the Task management tab → weak signal for feature usage intent
20 clicks on the “buy now” button → strong signal for buying intent
(number of ‘buy now’ clicks over the time period) / (total traffic over the time period). Adjust the estimated ‘buy now’ clicks taking into account estimated growth in traffic, and factor in drop-off rates in the buying process and customer churn.
MVP test results
50 users have become heavy users of the task management MVP.
80% (leap of faith assumption) of heavy users would be willing to pay. 50 * 80% * $50/month= $2000.
Adjust the estimated revenue taking into account estimated user growth. Factor in drop-off rates in the module buying process and customer churn.
Improving new user onboarding (the product-led growth scenario)

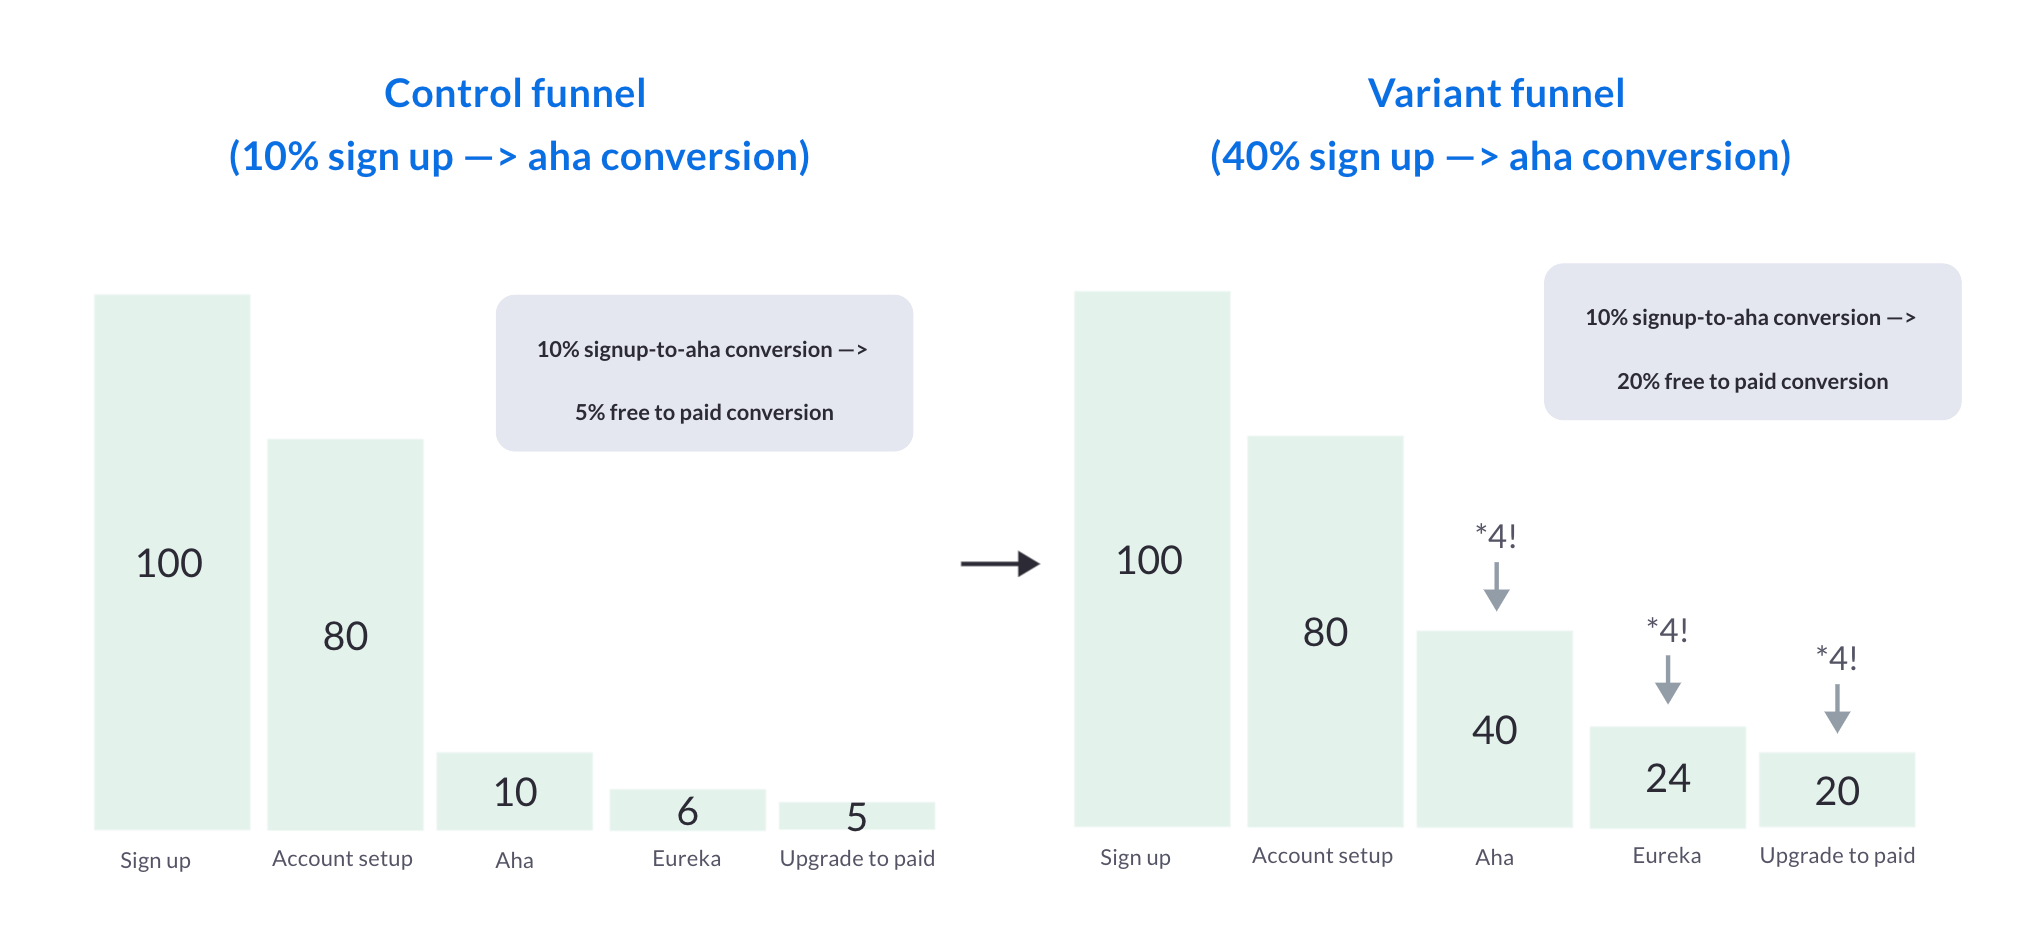
Scenario: Only 10% of our new users are getting to Aha. Of that 10%, 50% upgrade to a paid account.
Gather hard data for an evidence-based forecast
You ran an A/B test. Your variant included an onboarding survey (“What are you trying to achieve first?”) and sent new users through a personalized onboarding flow. You saw that the number of new users getting to Aha jumped to 40% - whoop whoop! The impact this had on the free-to-paid ratio is huge.
And before you start - You’re totally right: these numbers are not statistically significant! Oh the horror.
Read here to find out why I don’t worry too much about statistical significance, when we’re merely looking for a directional read to make a reversible product decision.
Revenue calculation example
Forecast the number of signups over the next year, based on sign-up growth from the past months or year. Multiply by 20%. For a full picture: Don’t forget to factor in churn, and adjust by expected macroeconomic / seasonality / any other deviations as needed.
Low volume/ big ticket size
A prime example of a low volume, high ticket size business model is a B2B business selling to enterprise customers. In the section below I outline how you can build a revenue forecast in a typical sales-led scenario: a custom feature request for a new, high-value prospect.

Prospect A - at a predicted ACV of $50,000 - says they will absolutely switch to your product….if only you added Okta Single Sign On to your project management software.
Gather hard data for an evidence-based forecast
Get a signed Letter of Intent with concrete timelines, pricing, and possibly a co-creation plan. The key is to get away from hypotheticals as much as possible.
Analyze how well this Okta Single Sign On fits to your ICP. Is this something you can resell?
Revenue calculations example
Revenue from the requesting prospect: €10,000/annually * probability of this prospect signing the contract. Even with a signed Letter Of Intent (LOI), they might not sign the real deal.
Revenue made from reselling to others. Analyze sales-loss reasons to gauge the percentage of deals for whom Okta SSO has been a blocking issue.
Example: You learn that over the past year, three deals were lost due to not having Okta SSO, at a combined value of $70,000. You can roughly assume that the company could earn $70,000 in the upcoming year if you implement Okta SSO, assuming you will have similar prospects to the one in the last year (e.g. same ICP, stable sales pipeline, etc.)
Revenue calculation rules of thumb
Keep the math simple, and only factor in what matters. No one (including you, one month from now) will be able to understand overly complex algorithms that try to factor in every edge case. Factor in the things you know will have a big impact, such as buying friction and churn.
Work with evidence-based numbers where you can. Look at historic data and run light-weight tests.
Assume that your forecast will still be off. Build in a buffer / include worst & best case predictions.
After idea/feature launch: Measure whether actual revenue growth lives up to the forecast. Analyze why it did or didn’t, so that you can improve your forecasting chops.
Why revenue prediction might not be the right ask
What remains is a painful truth: predicting revenue is impossible. Even when using experimentation basis as a foundation, this is still a far cry from a guarantee on how things will pan out in reality outside of the safe vacuum of an experimentation setting.
Actual revenue growth depends on a wide variety of factors that aren’t just outside your control, but even impossible to comprehend.
Our forecasts will be directionally accurate at best, but never precise.
Reason #1: PMs can’t be held accountable for revenue forecasts anyway.
Because of the above, PMs can’t be held accountable for whether their revenue forecasts have been accurate. If accountability appears to be wildly unfair, then why put effort into building revenue forecasts at all?
Reason #2: Revenue is a business goal. Product teams should focus on product goals instead
I often fall back on Teresa Torres’ distinction between business and product metrics:

Business metrics (such as revenue growth or customer churn) lag behind a change in customer behavior or sentiment. Staring at business metrics leaves Product Managers without a ‘so what’. Seeing a dip or increase in revenue leads to reactive work (trying to figure out what caused it), but hardly ever leads to actionable insights.
Product metrics measure whether your customers are likely getting value from your product, which is made visible through a change in their behavior or sentiment. For example: more users are getting to Aha, meaning that they experience the core value of your product for the first time. An increase in your sign-up-to-Aha rate is detected far more quickly than an increase in revenue (lagging indicator!). This product metric is also far better to inspire action, for example by looking at what might be blocking users from experiencing their Aha.
Product metrics are traditionally set by the product team in close collaboration with Leadership. Leadership should ensure that the product metric has a high likelihood of driving the primary business metric. It’s good to create customer value, it’s better if that also has a positive impact on your bottom line.
Rather than asking your Product Manager to create a revenue growth forecast, ask them to predict the outcome on their product metric. This is the realm where they should ‘play’.
It’s essential to close the loop: You need to check whether the positive impact on your team’s product metric moved the needle on the business metric (e.g. revenue).
Reason #3: Precise revenue forecasts can lead to imprecise pseudo-science
The big issue with revenue forecasts is that we’re at risk of sinking a lot of time into them, without getting much value. We can spend weeks building a beautiful forecast in Excel, and find out a year later that we were completely off.
Some voices plead for dropping the charade and using ICE instead, where impact is a ballpark revenue or margin figure and effort is a count of estimated developer+design weeks. This method attempts to quantify the potential impact in financial terms rather than using less precise sizing methods.
The problem of the inaccurate Impact estimate remains, but at least we steer clear from going down the forecasting rabbit hole, and we can be more honest about how rough our estimate is.
Conclusion
Accurately forecasting revenue for product ideas is a challenge, to say the least. It involves using proxies and estimates that are directionally accurate, rather than precise. Pulling in historical data, market data, and experimentation data can make forecasts more precise, but the harsh reality remains: We can’t predict the future.
It’s essential to measure the accuracy of our revenue forecasts after launch so that we can improve our forecasting skills - or do away with revenue forecasts altogether. A forecast is nice, but measurable outcomes are what matters.
Work with me? I work with SaaS startups and scale-ups as an advisor or as an interim product lead. Connect with me on LinkedIn if you’d like to chat.
Thank you Else, these posts and your posts on LinkedIn are really helpful for me as I'm still navigating the product space. For some reason, these posts always seem to come at the right timing. :)
PS: on the new user onboarding variant, i guess that the description in the image (top right box) is the one from the feature before and not related to the variant.